Create Account
Register with your email. Takes under 2 minutes.
Verify Identity
Complete KYC to unlock all platform features.
Fund Account
Deposit via bank transfer, card, or crypto.
Start Trading
Choose your market and place your first trade.
Opening and Verifying Your Account
Creating an account takes less than three minutes. You will need a valid email address and a password. After registration, you will receive a verification email — click the link to confirm your address before proceeding.
Identity Verification (KYC)
Before you can deposit funds or place trades, you must complete KYC (Know Your Customer) verification. This is a regulatory requirement and a security measure that protects your account from fraud.
KYC requires two documents: a government-issued photo ID (passport, national ID card, or driving licence) and a proof of residential address dated within the last three months (bank statement or utility bill). Upload clear photographs or scans through the verification section of your dashboard.
Verification is typically approved within one to two business days. You can explore the platform and review available instruments while you wait, but deposits and withdrawals are restricted until verification is complete.
Accepted Photo IDs
Passport, national identity card, driving licence. Must be valid, unexpired, and clearly legible.
Accepted Address Documents
Bank statement, utility bill, government letter. Must show your name, address, and be dated within 90 days.
Verification Timeline
Standard approval: 1–2 business days. You will receive an email confirmation once approved.
Depositing Funds
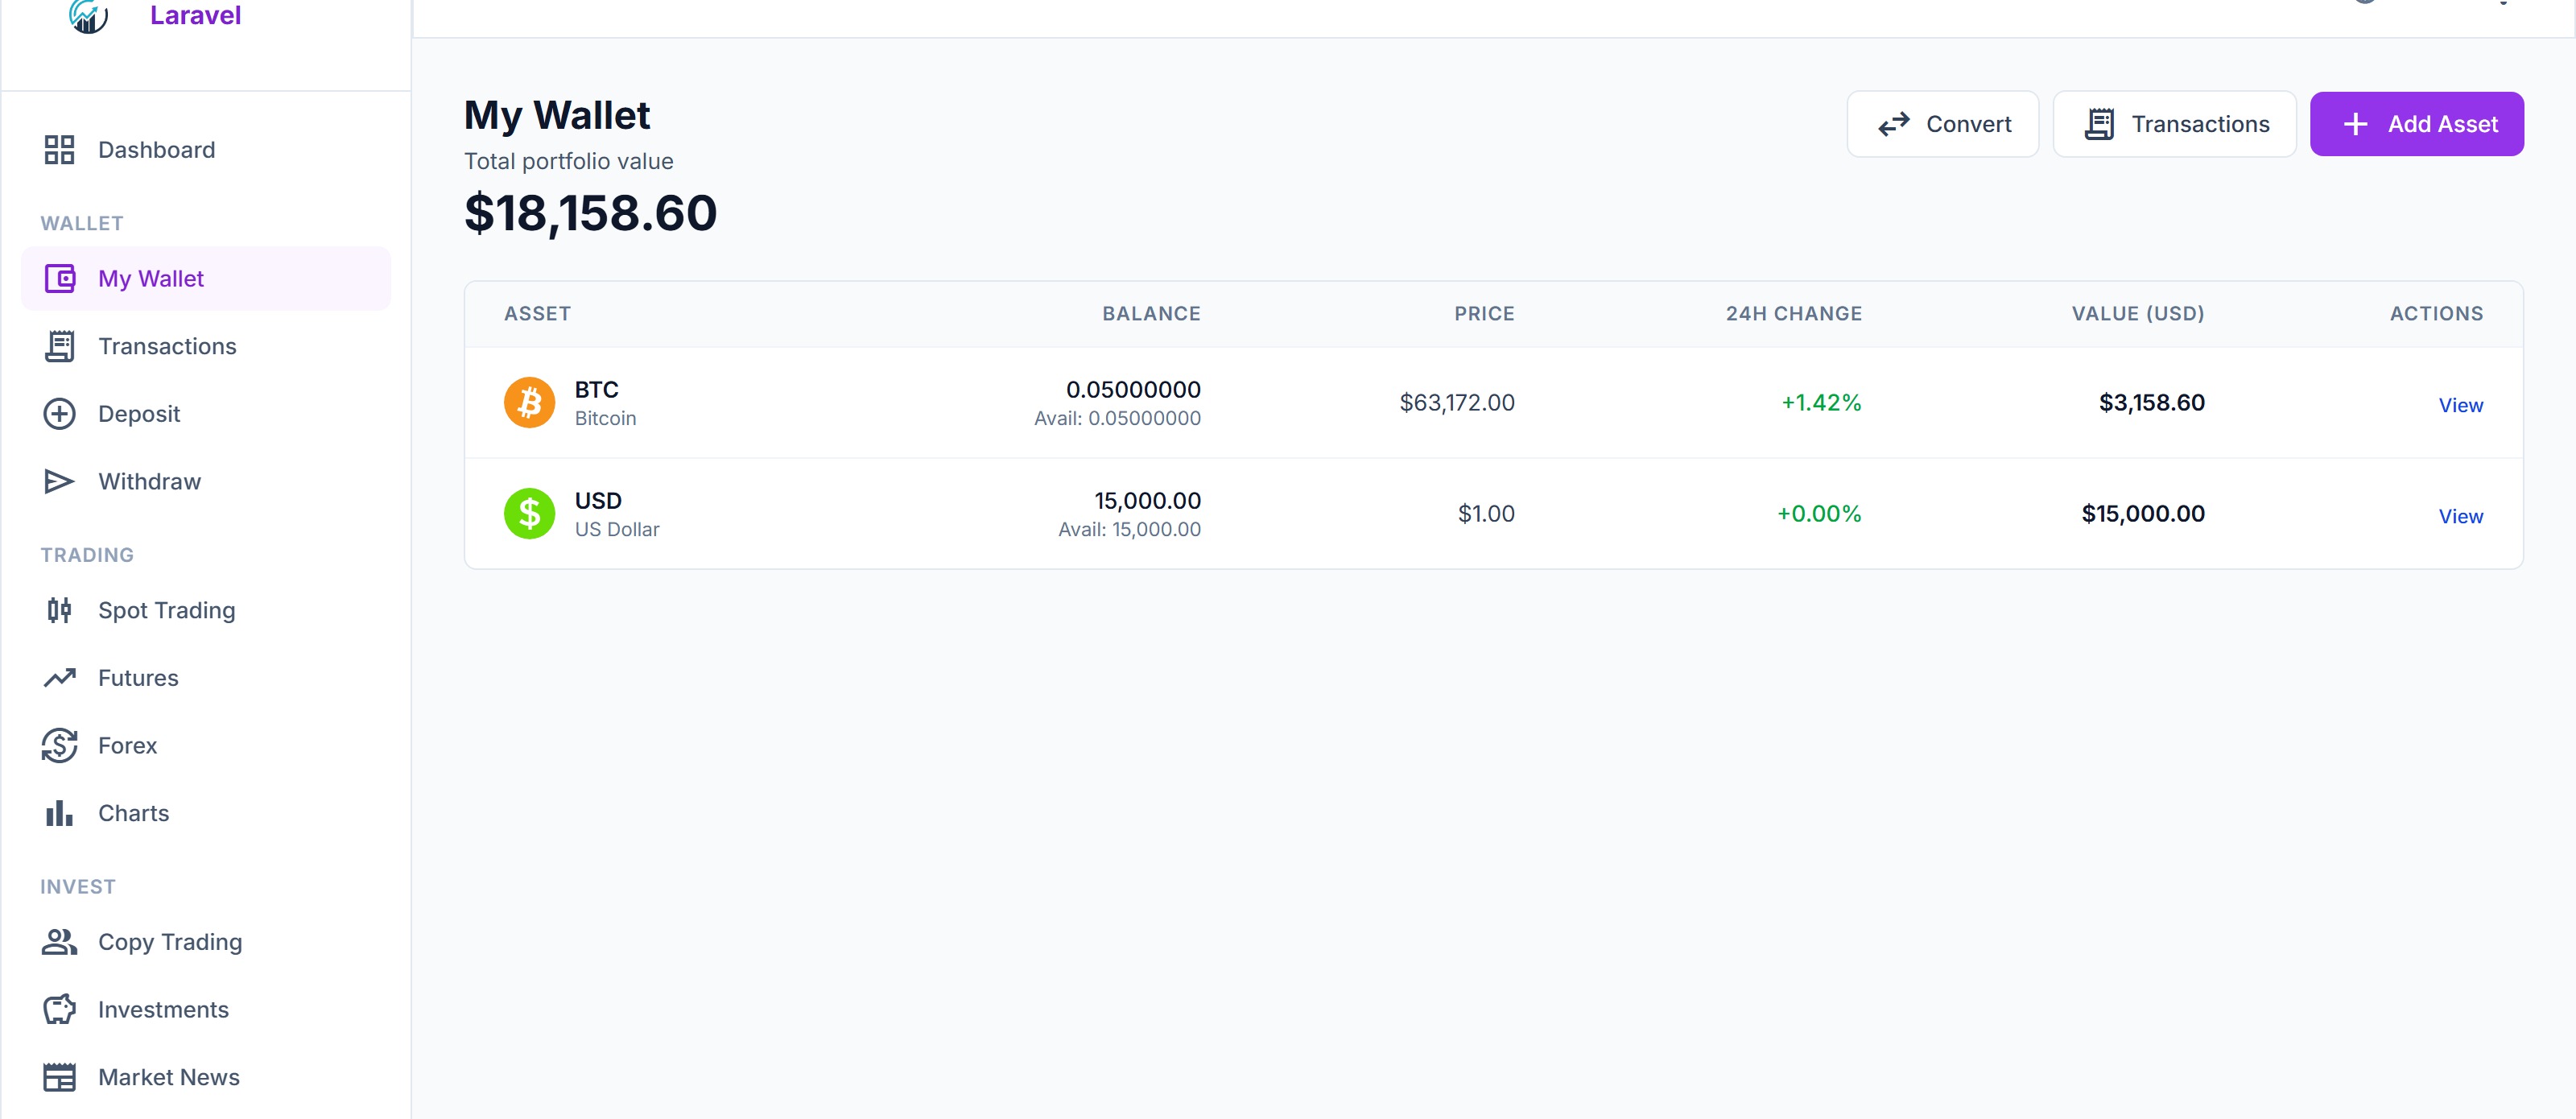
Once your account is verified, you can make a deposit from the Wallet section of your dashboard. There is no minimum deposit required to open an account — you can start with any amount you are comfortable with.
Bank Transfer
Standard bank wire transfer. Processing time is typically 1–3 business days depending on your bank and location.
Digital Wallets
Deposit using supported e-wallets and payment processors. Typically credited within minutes after confirmation.
Cryptocurrency
Deposit directly in supported cryptocurrencies. Credited after blockchain confirmation, which typically takes minutes.
Withdrawals follow the same methods as deposits. Funds are returned to the same source they came from as a fraud prevention measure. Withdrawal requests are processed within one to two business days after submission.
Understanding the Platform
Dashboard
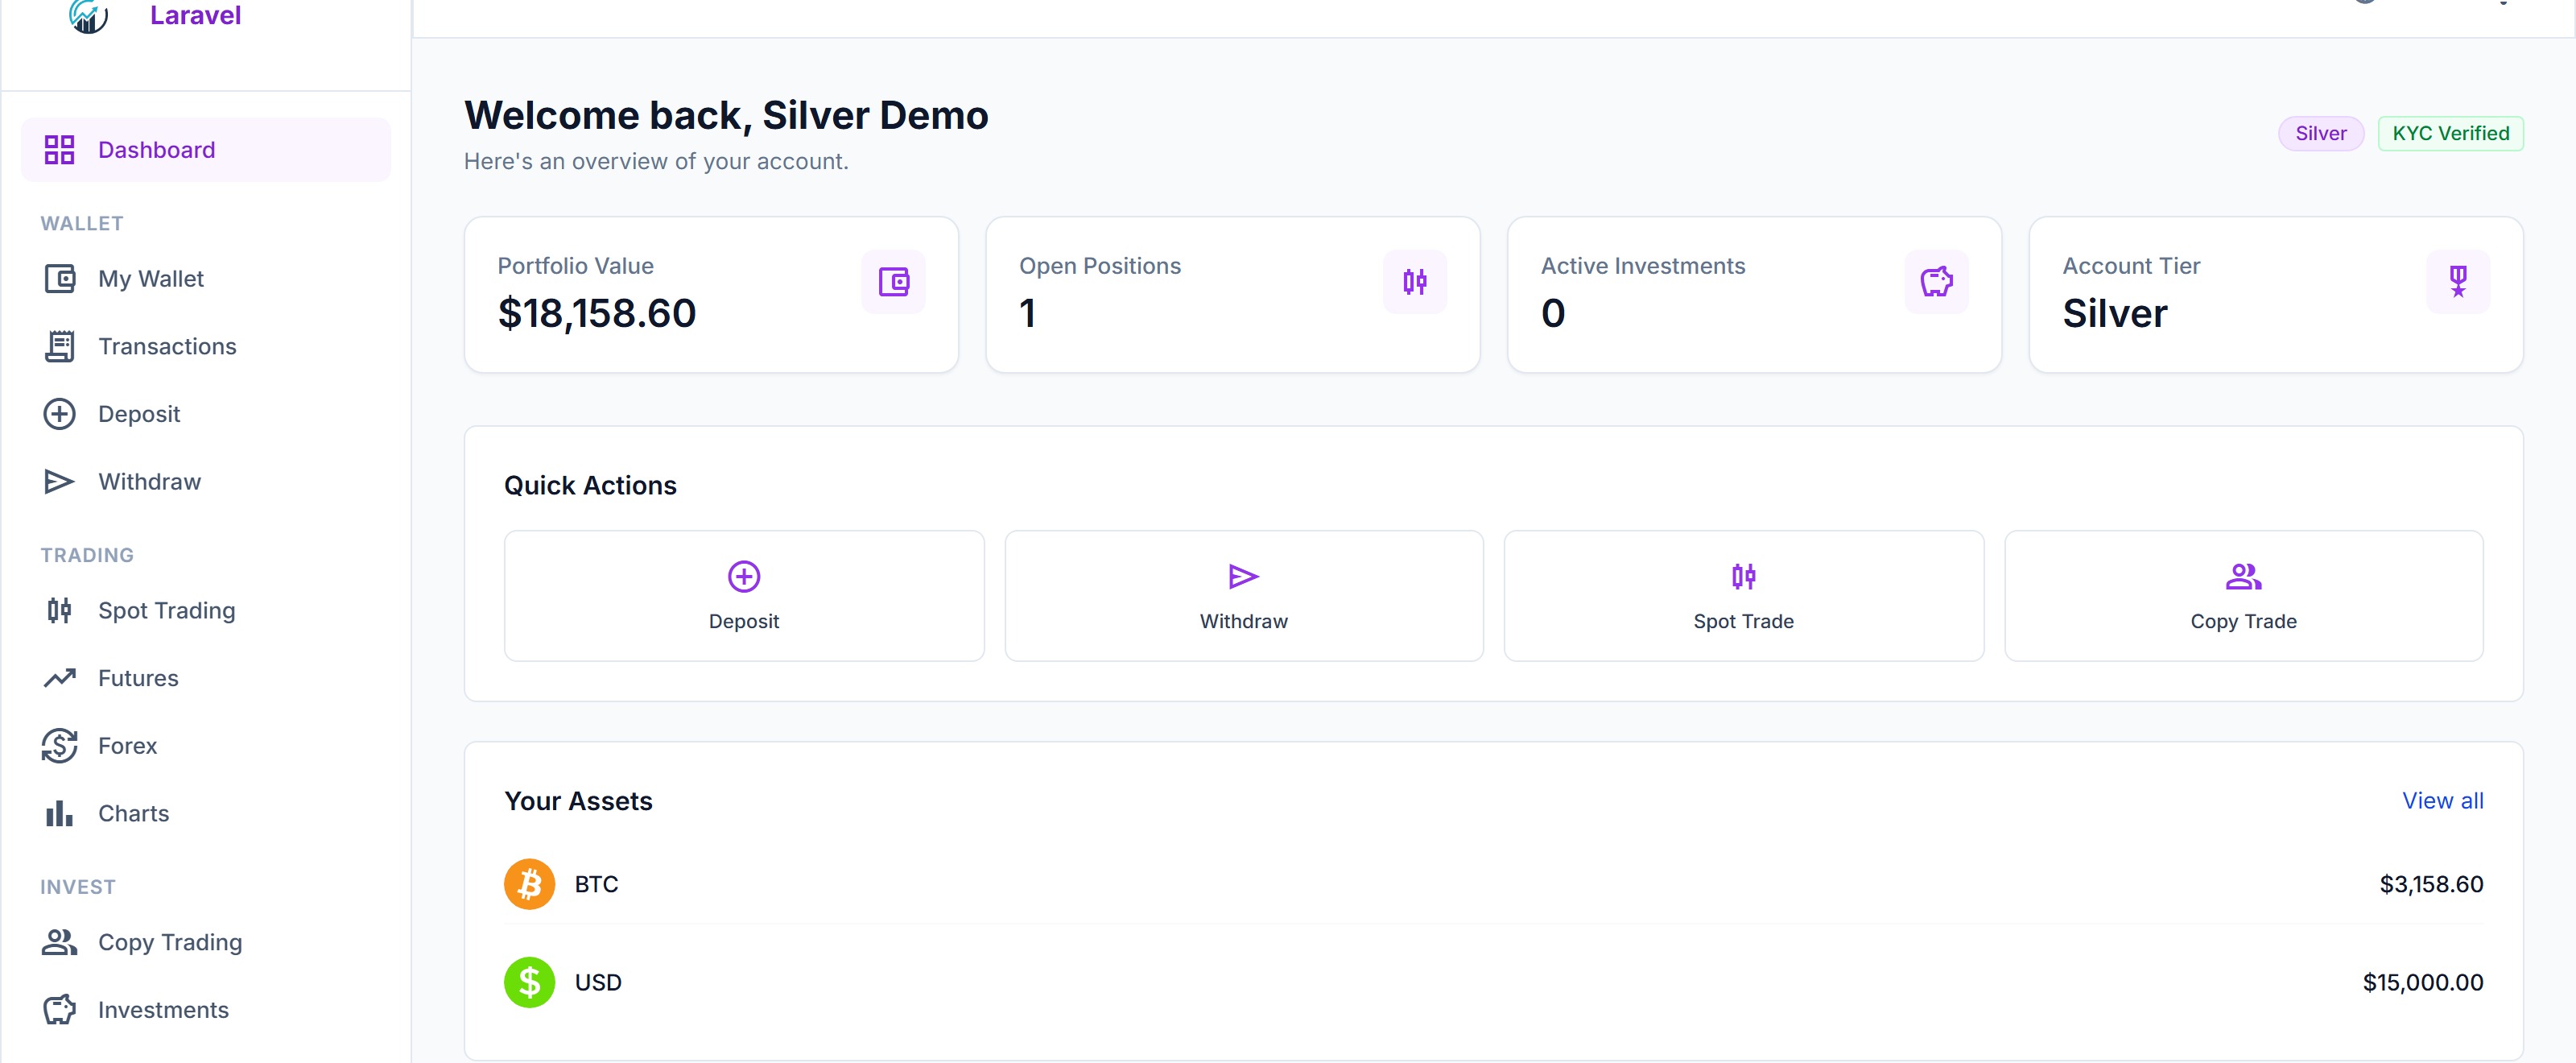
Your dashboard is the central hub showing your account balances, open positions, recent transaction history, and any important announcements. The summary cards at the top show your total equity, available margin, and current P&L across all open trades.
Trading Pages
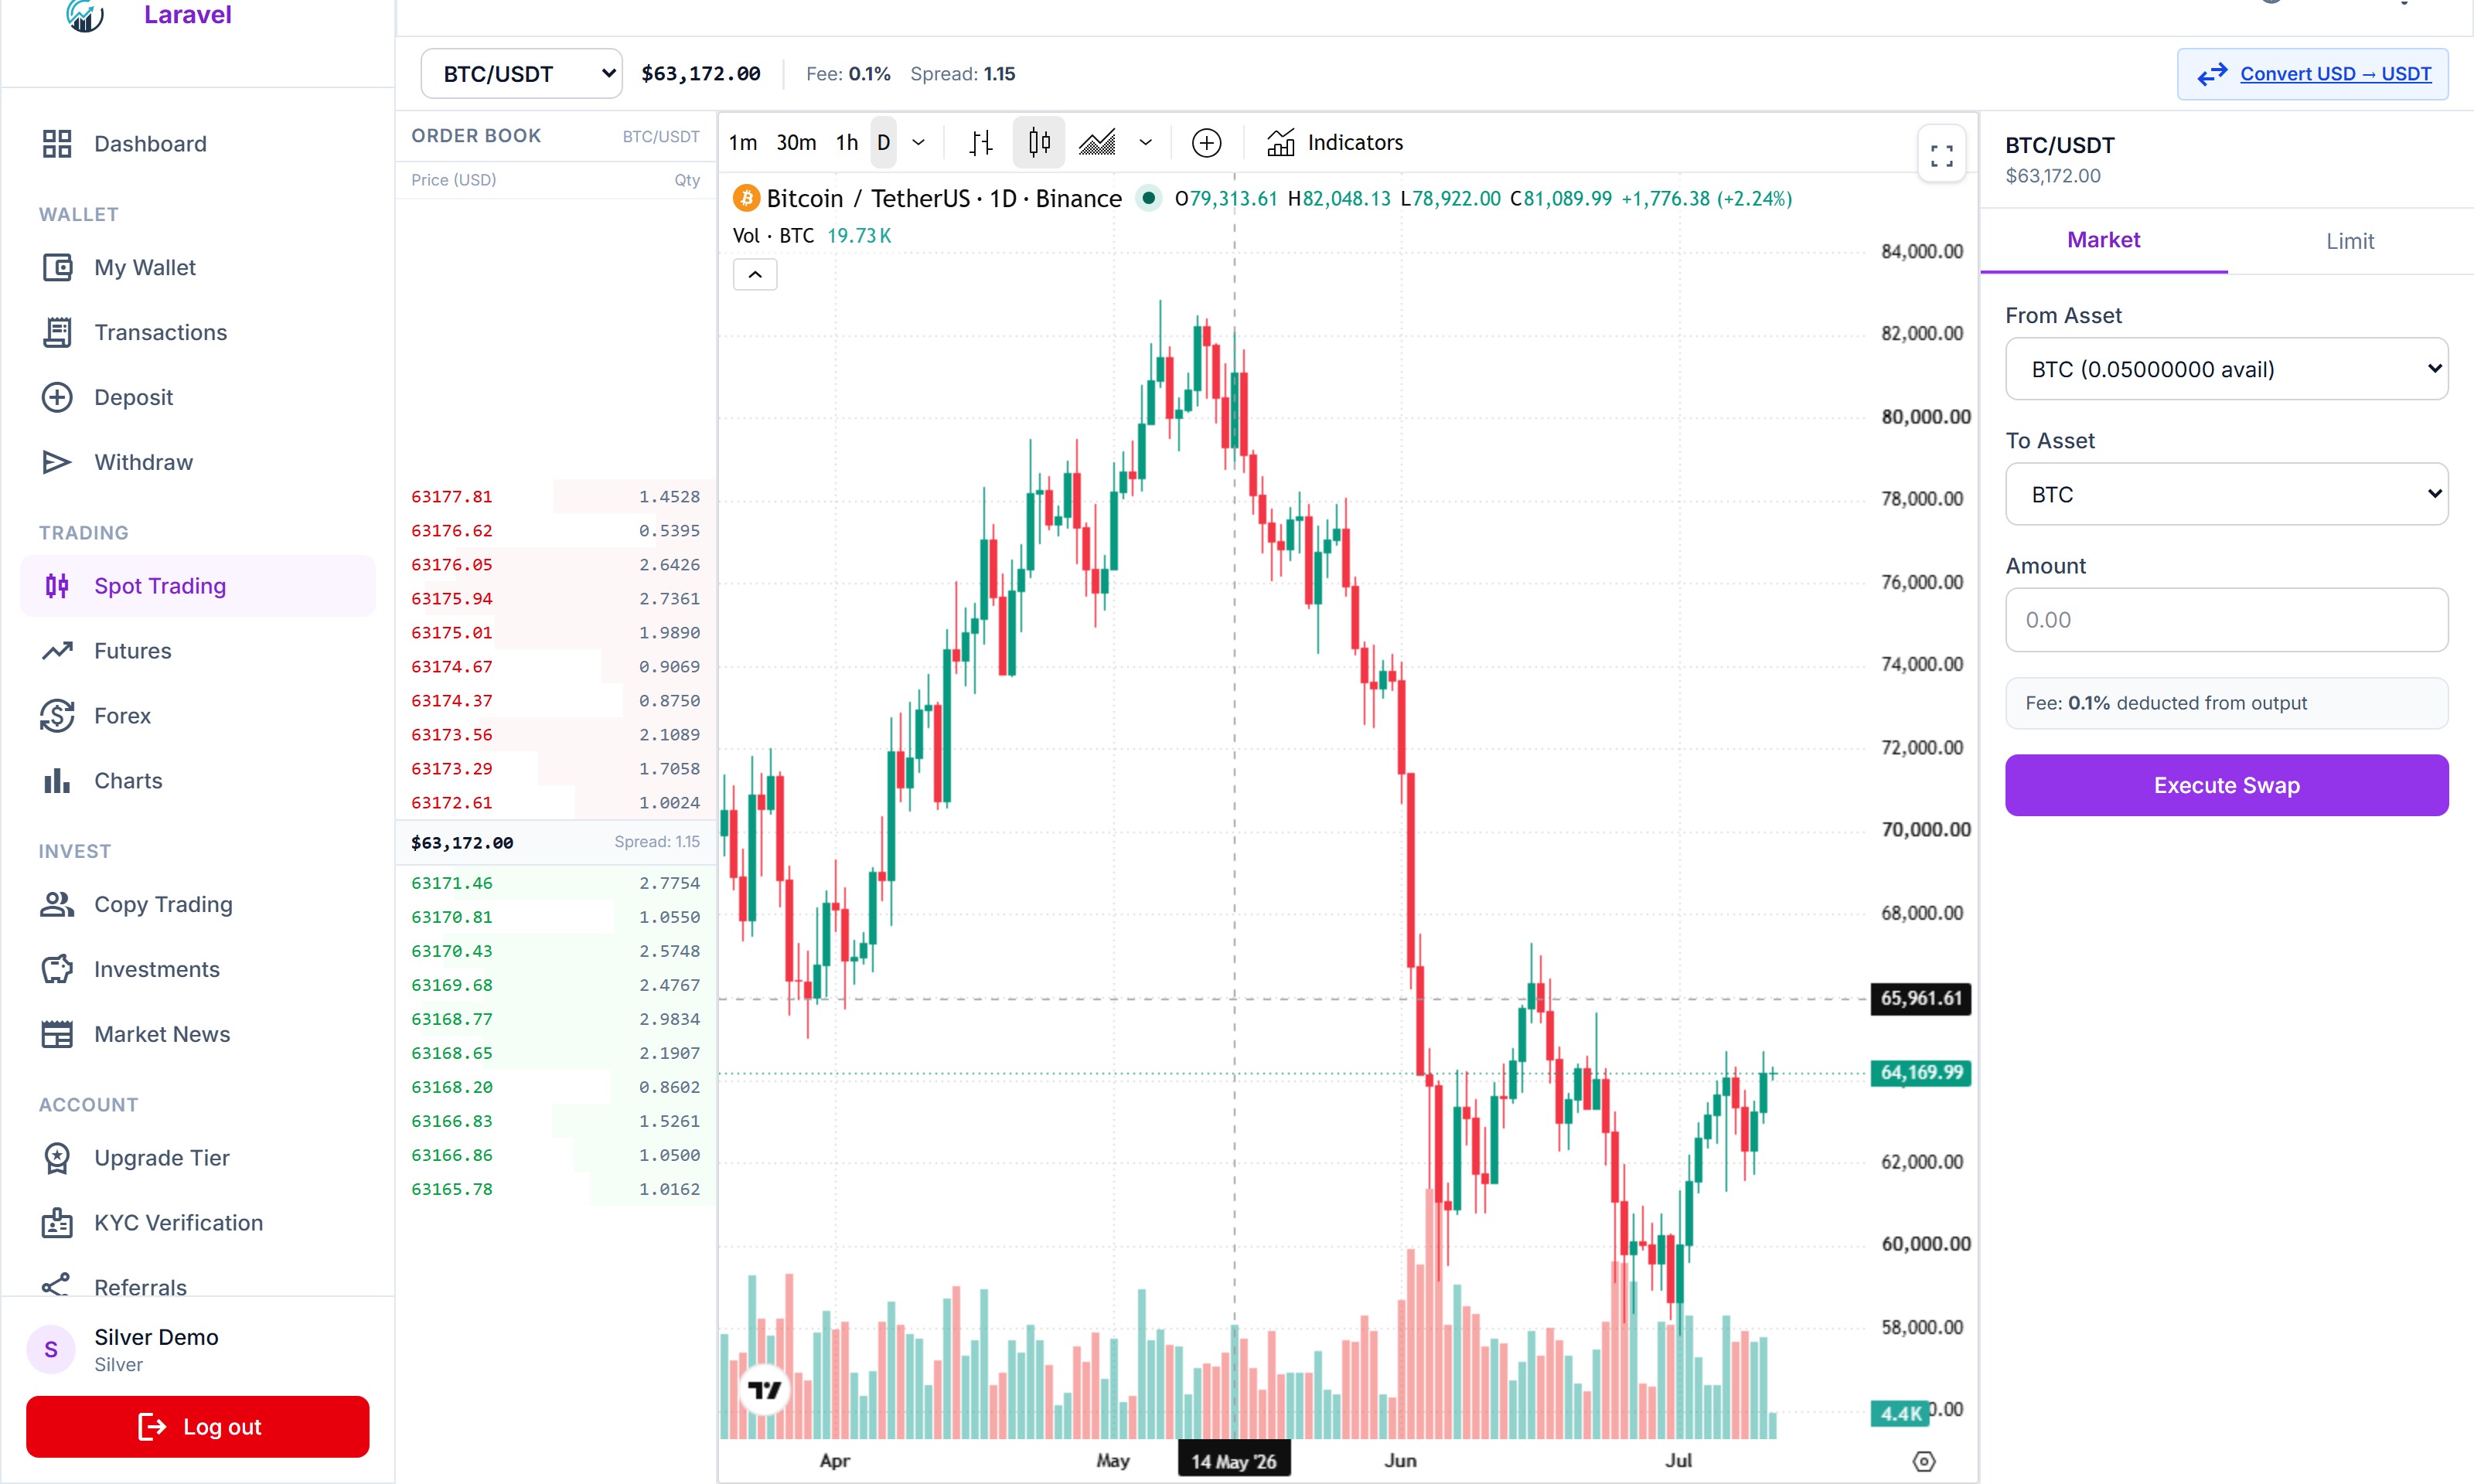
Navigate to Trade in the sidebar to access Spot (crypto), Futures (commodities, indices, crypto), and Forex markets. Each page includes a live TradingView chart, a real-time order book showing bid/ask depth, and an order form where you can place market or limit orders with optional stop loss and take profit.
Wallet
Your wallet holds balances across currencies. You can deposit, withdraw, and view your full transaction history from the Wallet page. The wallet also shows your margin utilisation — how much of your available balance is being used as collateral for open positions.
Copy Trading
Automatically mirror the trades of experienced verified traders. Set your capital allocation and the system handles execution. You can monitor your copied positions and stop copying at any time without penalty.
Investments
Subscribe to structured investment plans with fixed return cycles. Suitable for passive income strategies where you commit capital for a set period and receive returns at maturity.
Key Trading Concepts
Spread
The spread is the difference between the buy (ask) price and the sell (bid) price. For example, if EUR/USD has an ask of 1.0845 and a bid of 1.0843, the spread is 0.0002 (2 pips). The spread is how brokers generate revenue on most trades — you enter a trade already at a small cost equal to the spread.
Leverage
Leverage lets you control a larger position with a smaller deposit. A 100:1 leverage means $100 controls a $10,000 position. Both gains and losses are calculated on the full position size, so leverage amplifies both upside and downside. Always set a stop loss when using leverage.
Margin
Margin is the collateral required to open a leveraged position. It is a percentage of the total trade value. If your account equity falls below the required margin level (margin call level), positions may be automatically closed to prevent your balance from going negative.
Stop Loss and Take Profit
These are automatic orders that close your trade when price reaches a specified level. A stop loss limits your maximum loss on a trade by closing it if price moves too far against you. A take profit locks in gains by closing the trade when your target is reached. Always set both before walking away from an open position.
Pip
A pip is the smallest standardised price movement in forex trading. For most pairs, it is 0.0001 (the fourth decimal place). For USD/JPY and other yen pairs, it is 0.01 (the second decimal place). Knowing your pip value for a given lot size helps you calculate risk in currency terms before you place a trade.
Reading Your First Chart
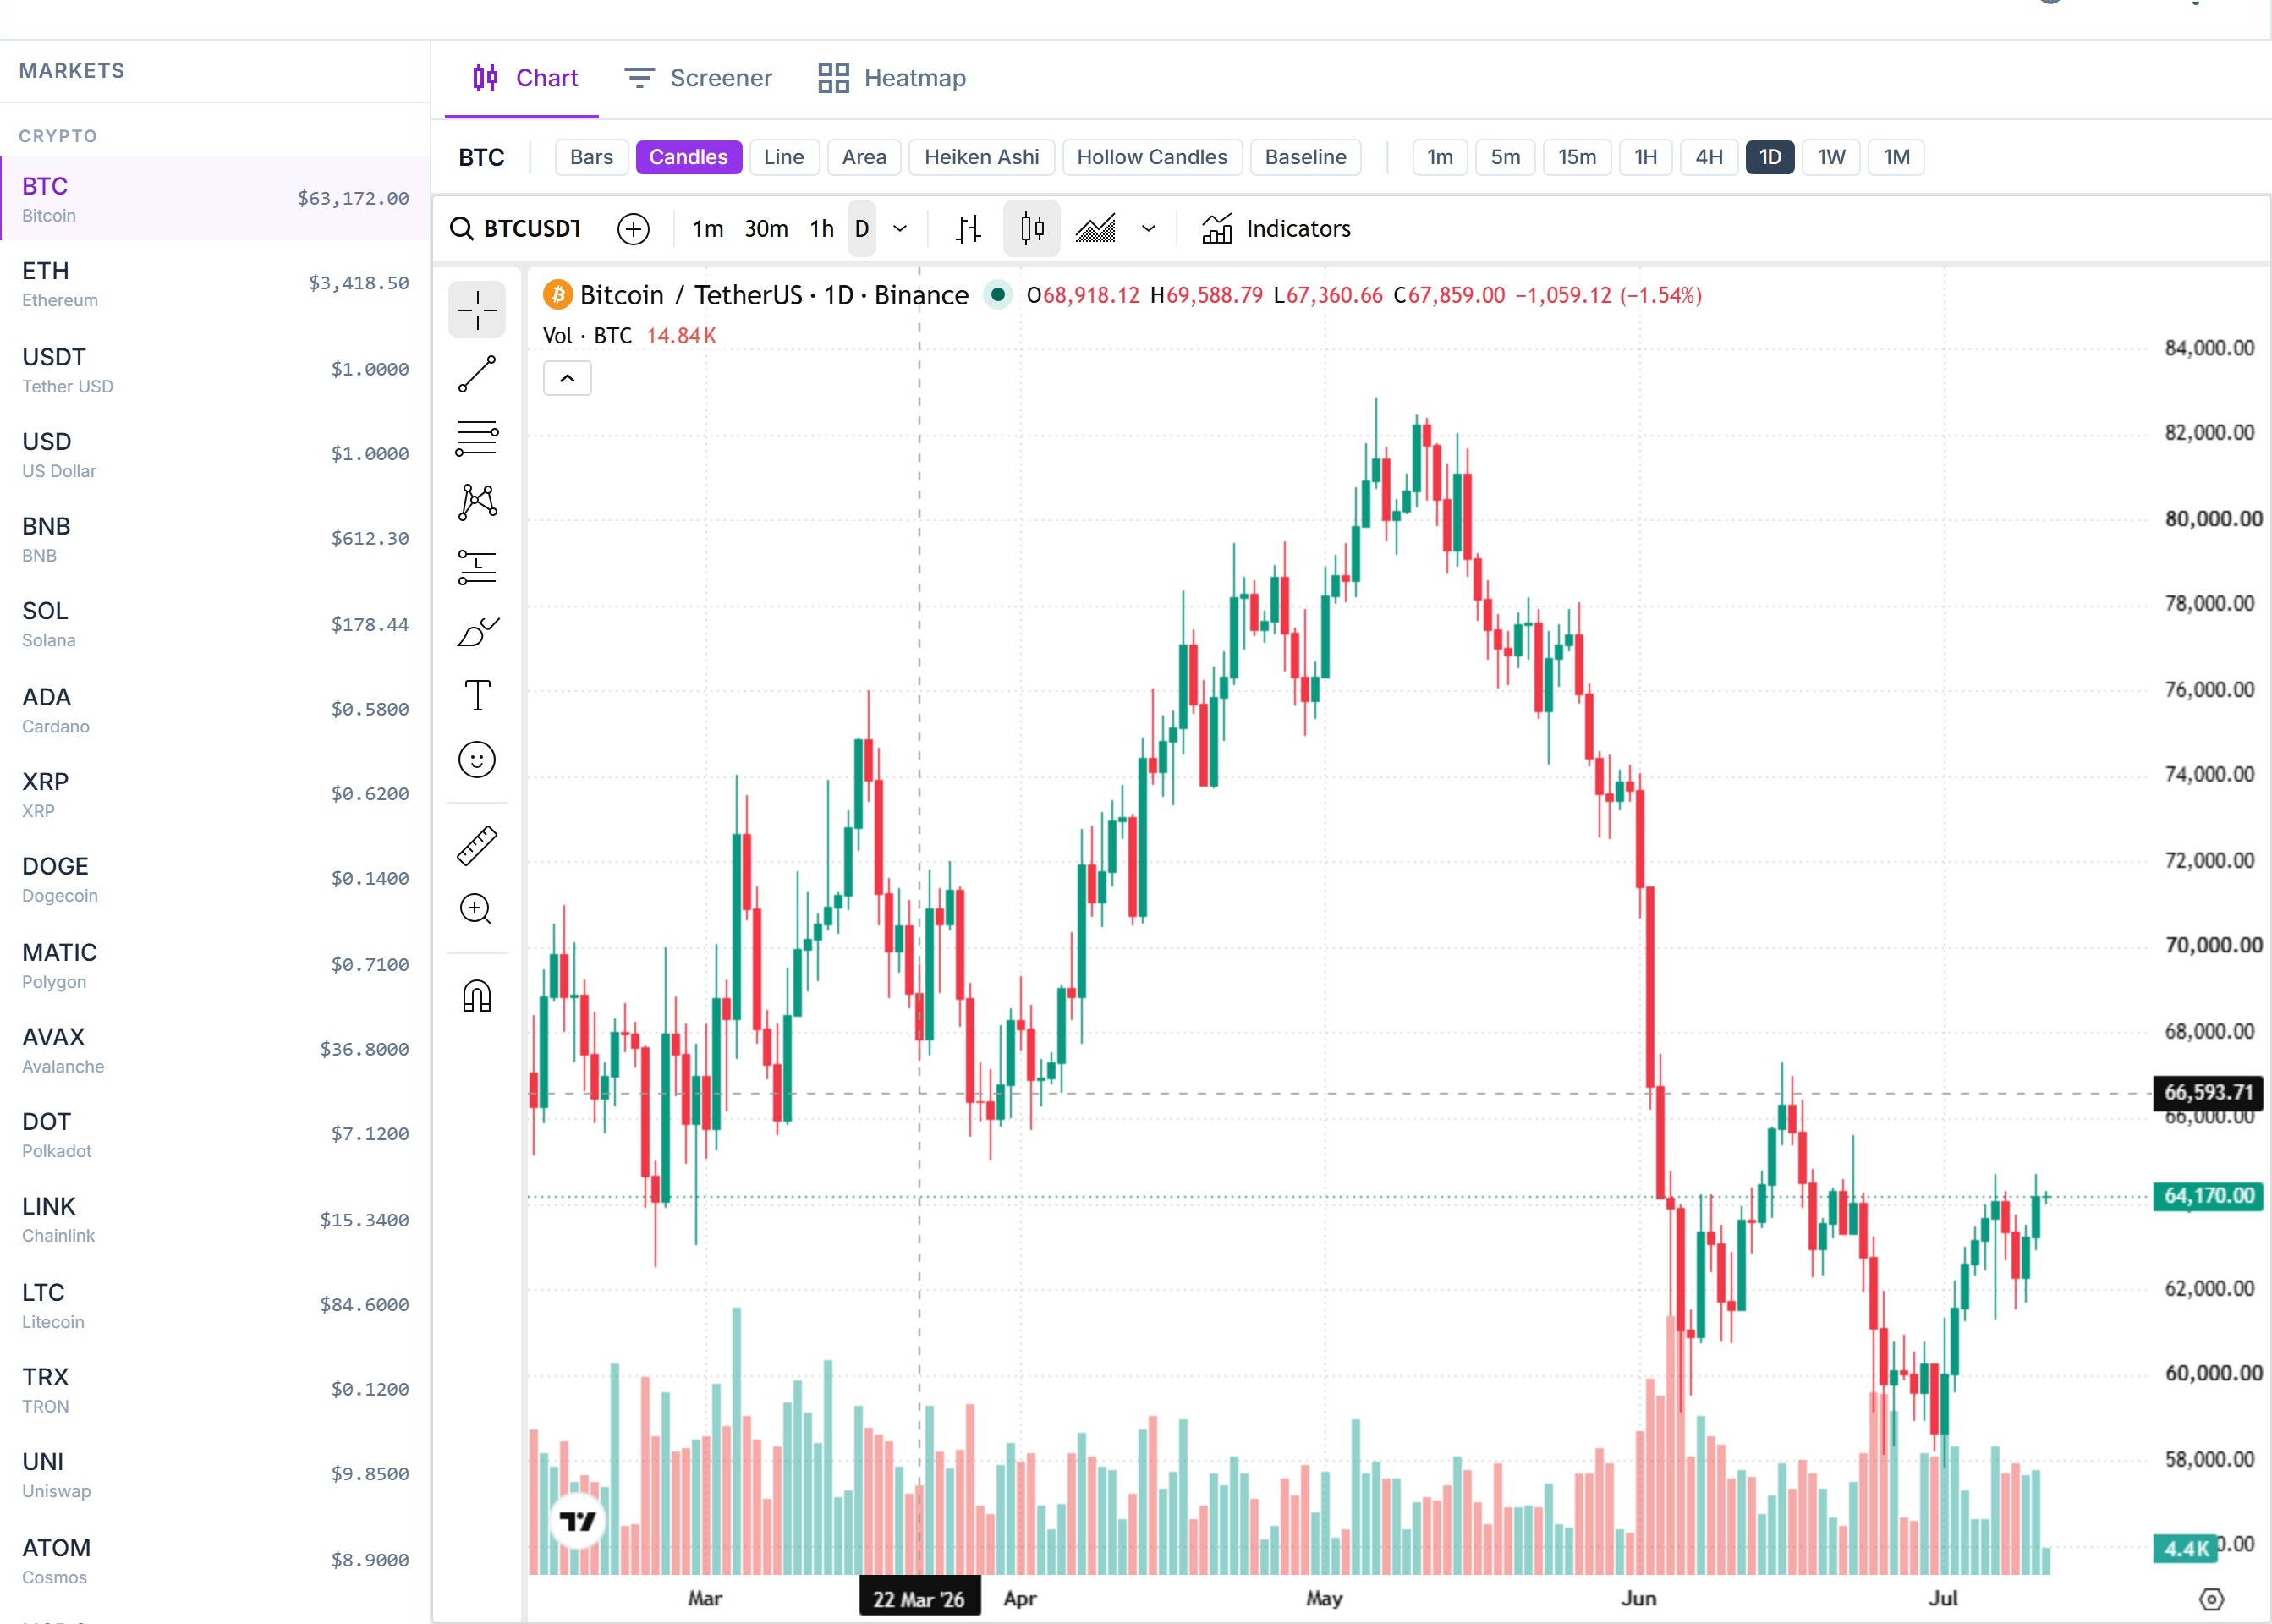
Every trading page features a TradingView chart. Understanding what you are looking at is the first step to making informed trade decisions. Here are the fundamentals.
Candlestick Charts
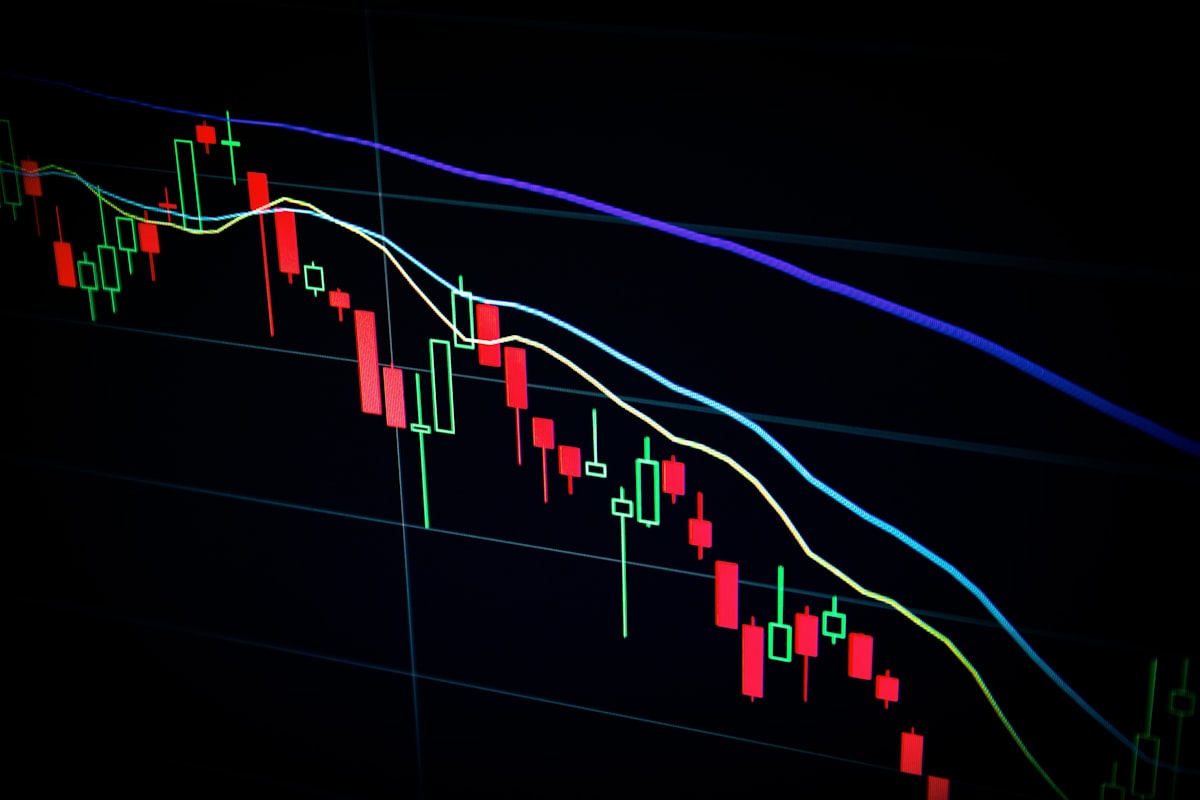
Candlestick charts are the default view on most trading platforms. Each candle represents price movement over a period of time (the timeframe). A candle has four data points: the open price, the close price, the highest price reached, and the lowest price reached during that period. A green (or white) candle means price closed higher than it opened. A red (or black) candle means price closed lower.
Timeframes
The timeframe controls how much time each candle represents. A 1-minute chart shows one candle per minute; a daily chart shows one candle per day. Shorter timeframes show more detail and are used by scalpers and day traders. Longer timeframes (4H, Daily, Weekly) show the bigger picture and are used by swing traders and position traders. Most traders use multiple timeframes — analysing the daily chart for direction and the 1-hour chart for entry.
Support and Resistance
Support is a price level where buying pressure has historically been strong enough to stop price falling further. Resistance is a level where selling pressure has historically capped upward moves. These levels are visible as areas where price has reversed multiple times on the chart. Trading around key support and resistance is one of the most common and effective analytical approaches.
Volume
Volume shows how many units of an asset were traded during a given period. High volume on a price move confirms that the move has broad market participation — it is more likely to be meaningful and sustainable. Low volume moves are more easily reversed. Volume spikes often coincide with news events or breakouts from key price levels.
Moving Averages
A moving average is a line that plots the average closing price over a set number of periods. The 20-period moving average (20 MA) shows average price over the last 20 candles. Moving averages smooth out price noise and help identify the prevailing trend direction. When price is above the 200-day moving average, the asset is generally considered to be in a long-term uptrend.
RSI — Relative Strength Index
RSI is a momentum indicator that measures the speed and magnitude of recent price changes. It oscillates between 0 and 100. Readings above 70 suggest the asset may be overbought (due for a pullback). Readings below 30 suggest oversold conditions (potential bounce). RSI is most useful as a filter — confirming a trade idea rather than generating one on its own.
Order Types Explained
Understanding the difference between order types gives you more control over your entry price, risk, and execution quality.
Market Order
Executes immediately at the best available price. Use when you need to enter or exit quickly and are willing to accept the current spread. During volatile market conditions, the execution price may differ slightly from the price shown when you submitted the order — this is called slippage.
Limit Order
Executes only at a price you specify (or better). Use when you want to buy below the current price or sell above it — waiting for price to come to you. A limit order gives you price control but no guarantee of execution if price never reaches your level.
Stop Loss Order
Automatically closes your position if price moves against you by a specified amount. Every trade should have a stop loss. It removes the temptation to hold losing trades too long and protects your account from catastrophic losses. Set it before you walk away from a trade.
Take Profit Order
Automatically closes your trade when price reaches your profit target. Lets you lock in gains without having to watch the screen constantly. Once your take profit is set and the trade is running, you can leave it to execute without emotional interference.
Stop Entry Order
Opens a new position when price moves through a specified trigger level. Useful for breakout strategies — you set an order to buy if price breaks above resistance, or sell if it breaks below support. This lets you capture momentum moves without watching charts all day.
Common Beginner Mistakes to Avoid
Understanding the pitfalls that trip up most new traders will save you time and capital as you build your skills.
Trading Without a Stop Loss
The most common and costly mistake. Without a stop loss, a single bad trade can wipe out weeks of gains. Always set a stop loss, even if you are only entering a small position.
Risking Too Much Per Trade
Risking 20–50% of your account on a single trade means one loss is catastrophic. Professional traders typically risk 1–2% per trade. This keeps you in the game long enough to let your edge play out.
Overtrading
Placing too many trades in pursuit of quick profits leads to higher transaction costs and poor decision-making. Quality over quantity — wait for setups that match your criteria rather than trading out of boredom or impatience.
Chasing Losses
After a losing trade, the instinct is to immediately re-enter to "get it back." This leads to impulsive decisions and larger losses. Accept losses as part of trading and move on with your process.